
3D Visualization and Urban Design lecture 6 October
From Sketch to City - students turn concepts into immersive 3d urban prototypes.
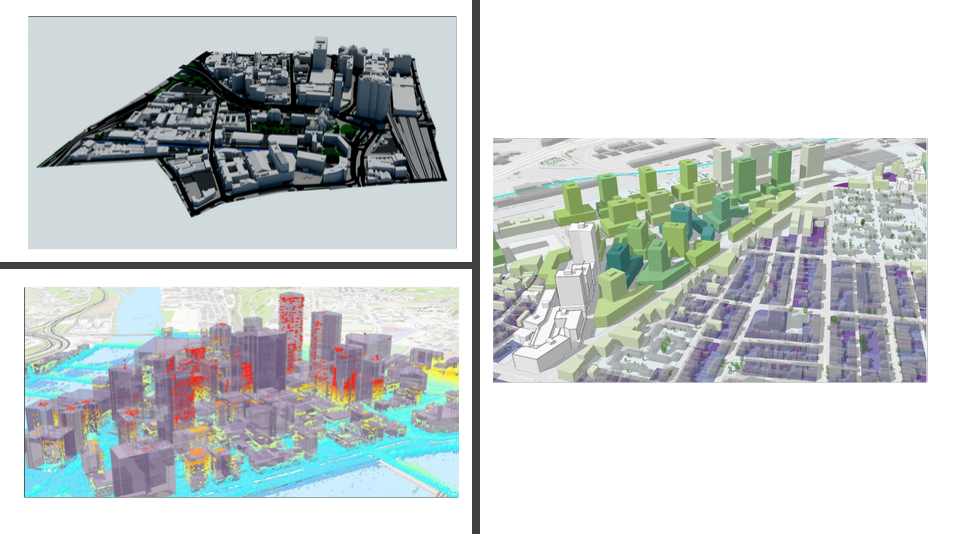
Over 60 hours of lectures, labs, and guided teamwork, participants transformed site analyses into 3D city scenes and VR walkthroughs that effectively communicated accessibility, mobility, and green infrastructure ideas to non-technical stakeholders. Mentoring and step-by-step scaffolding kept mixed-ability teams aligned on goals, while peer critiques honed clarity and impact.
Outcomes included campus-scale public-space concepts, daylight/visibility studies, and short demo videos. Students reported greater confidence with visualization pipelines and a better understanding of evidence-based urban design—from initial sketches to publishable results.
Innovation Sprint in the Studio - double diamond for better streets
The course incorporated a two-week innovation sprint, utilizing the Double Diamond phases: Discover, Define, Develop, and Deliver, to frame urban challenges and prioritize interventions. Teams interviewed users, mapped pain points, and iterated on 3D scenarios before delivering a VR-ready concept backed by concise metrics (walk times, shading, wayfinding clarity).
The sprint format balanced creativity with structure, giving students time-boxed milestones, rubric-based feedback, and mentoring check-ins that mirrored professional urban design practice.
Cross-Faculty Collaboration - from visual stories to actionable urban briefs
Participants from IT, design, architecture, and environmental programs co-created visual briefs that combined maps, models, and stakeholder narratives to convey complex information. Emphasis on storytelling helped translate technical insight into policy-friendly recommendations.
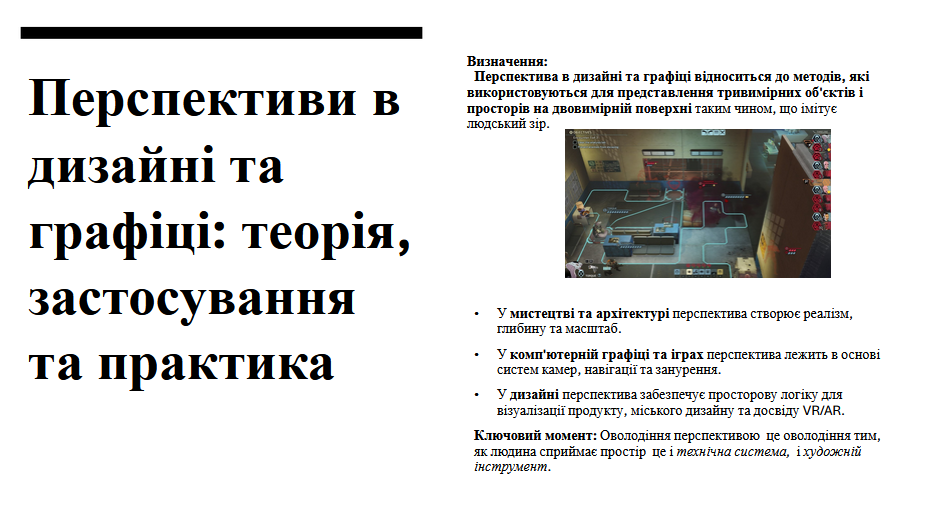
Faculty reflections stress the value of scaffolded teamwork (clear roles, prototype reviews) and a stronger link between visualization outputs and decision-maker needs. Next steps include expanding the lab to encompass city-scale digital twin datasets and multi-criteria evaluation dashboards.
Volodymyr NAZARENKO